
Creating a new project
If there isn't a nearby project for you to join, or you'd like to create your one,own, you can create a new Trap.NZtrap.nz project.
For video help, click the YouTube link here https://www.youtube.com/watch?v=ozNCAAqJlfU
- Ensure you're signed up and logged in.
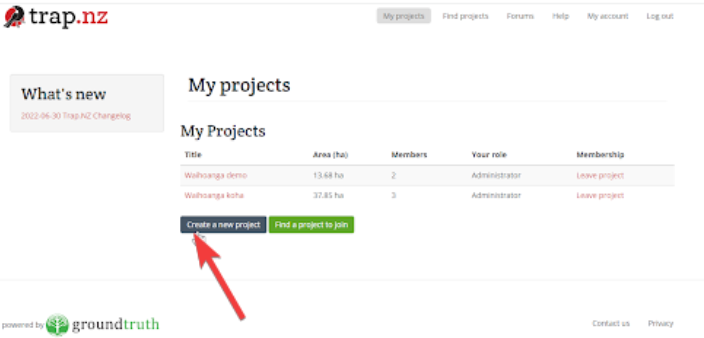
- Go to "My Projects" and click the "Create a new project" button near the bottom of the page.
- Fill out the form with the details for your project (only fields marked with an asterisk* are required):
- Listing your project publicly and providing as much information as possible will make it easier for others to find your project and request to join in.
- Sharing summary data allows information from your project (eg. trap numbers, catch counts, baits used, etc.) to be used by other websites. Making summary data available contributes to the national dataset and is invaluable for research into predator control in NZ. You can see an example of how this information is used at Predator Free Wellington. Personal details are not shared and individual trap locations are aggregated at a 200m (4 hectare) square grid level.

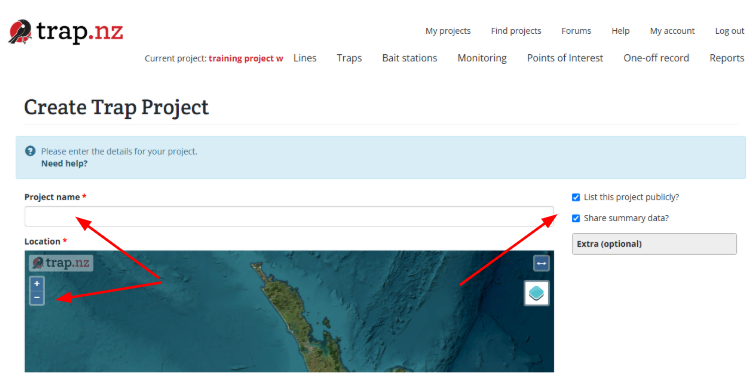
- Use the map controls to zoom into your desired project area
- The +/- icons in the top left corner of the map can be used to zoom
- You can pan around the map by clicking and dragging anywhere on the map
- The <-> icon in the top right of the map can be used to make the map full screen
- You can escape fullscreen mode by pressing the X icon in the top right of the map
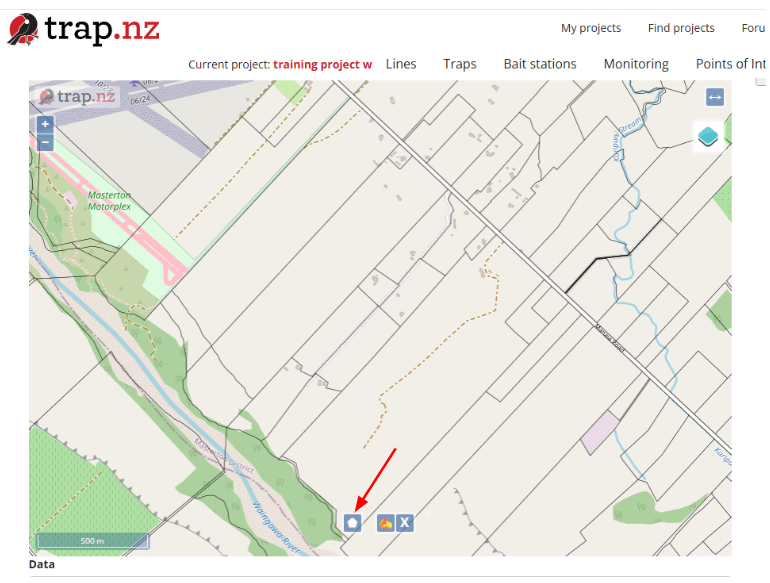
- Draw the area of your project on the map
- Make sure that the area you want your project is completely visible within the map view before you
beginbegin.It is easier to create the boundaries for a project using the layers LINZ parcel boundaries and OpenStreetmap. This is a great way to ensure you don’t accidentally include the neighbours' property
- Make sure that the area you want your project is completely visible within the map view before you
- Click the polygon tool (the pentagon icon at the bottom of the map), then draw on the map to define the area you want to manage.
There
After availableselecting a starting point, move to a second point and click there. As you move the pointer around the project boundary, make sure you click on howeach spot before you change it to useanother direction
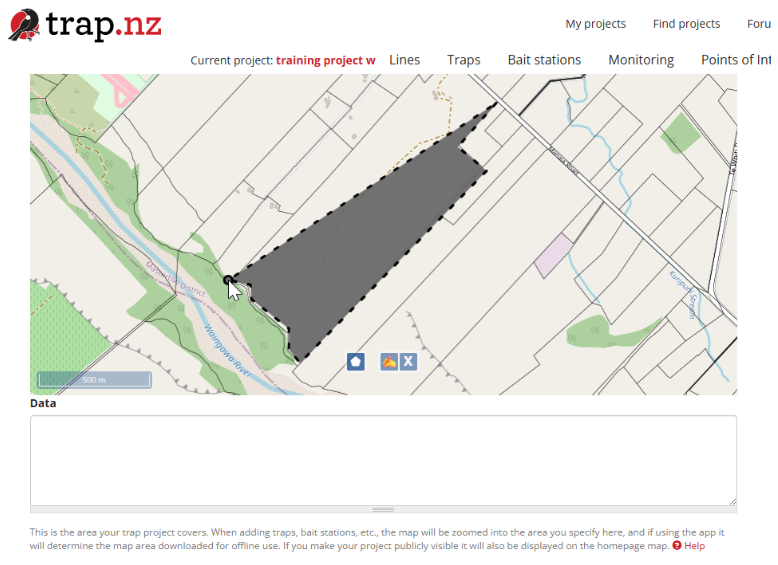
To close your polygon, click back at your starting point - the mapline drawingwill toolturn green - this means the polygon is properly closed. This will automatically fill the data field with the boundary coordinates.
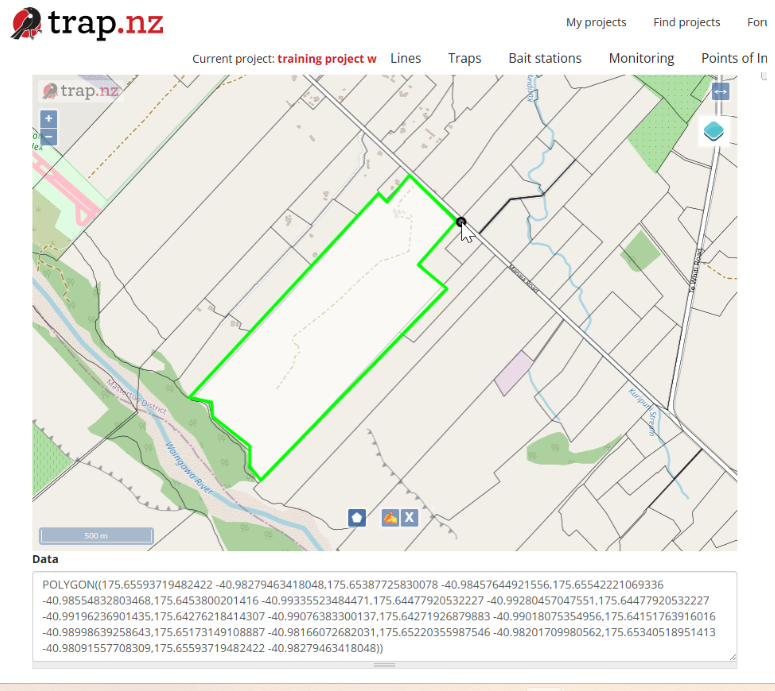
.
- If you have WKT format data from a GIS system (eg. ArcGIS or Quantum) you can cut and paste the WKT into the Data box beneath the map instead of manually drawing a map.
Note: the CRS is ESPG:4326
- If you have WKT format data from a GIS system (eg. ArcGIS or Quantum) you can cut and paste the WKT into the Data box beneath the map instead of manually drawing a map.
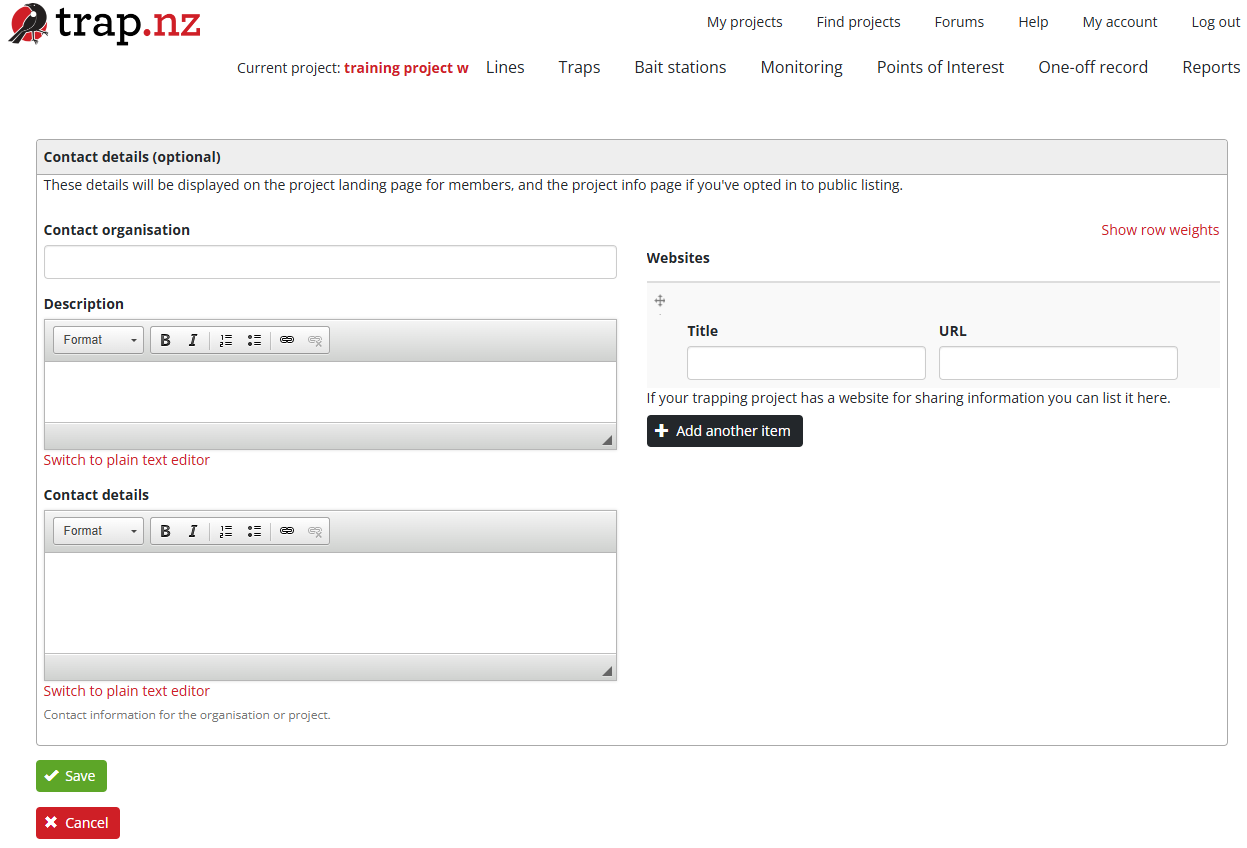
- Fill out any parts of the "Contact details" section that you wish to (you can edit this later)
- Click the "Save" button at the bottom of the page
Once you've created your project you can start adding lines, traps and bait stations, monitoring stations, and points of interest, and you can invite others to join your project.
For video help click the you tube link here https://www.youtube.com/watch?v=ozNCAAqJlfU