
Project reporting
This is helpful for externally funded projects that are required to provide evidence of results achieved by the project.
The reports are broken into sections, Trap reports, Bait station reports, and Monitoring reports
Links to these reports can be found under the reports heading on your project page and can be generated using a variety of filters to show the data wanted.
The most commonly used are:
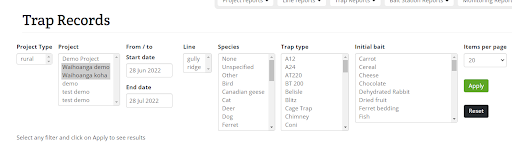
Trap records with map View/Download trap records. Optionally filter by date, species caught, etc
Heatmaps are available via the layer switcher (top right of the map)

Multi-project trap records Report traps across multiple projects

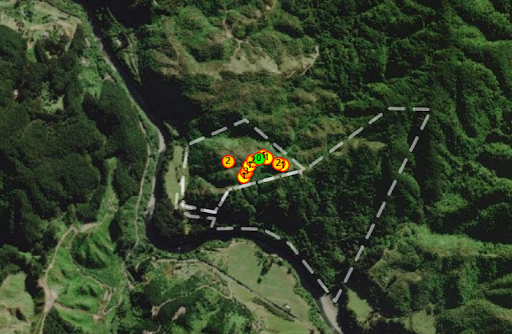
Or Multi-project trap records (with map) This shows a difference between projects in a visual way. Allowing the users to see what each project is achieving.
This shows the date the installations were last serviced. This helps ensure they do not fall outside of their default maintenance period.
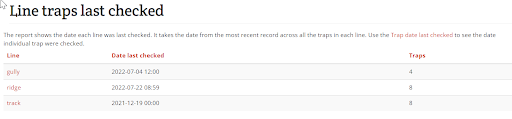
Trap date last checked with map

Multi-project Line date last checked

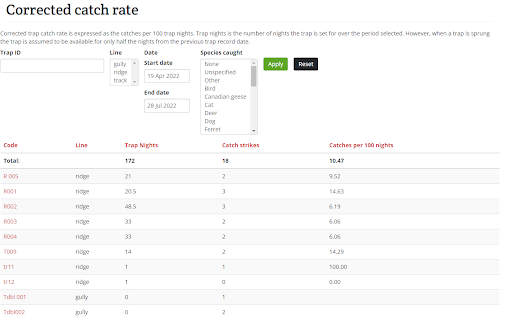
Corrected catch rate The corrected trap catch rate is expressed as the catches per 100 trap nights. Trap nights are the number of nights the trap is set for over the period selected. However, when a trap is sprung the trap is assumed to be available for only half the nights from the previous trap record date
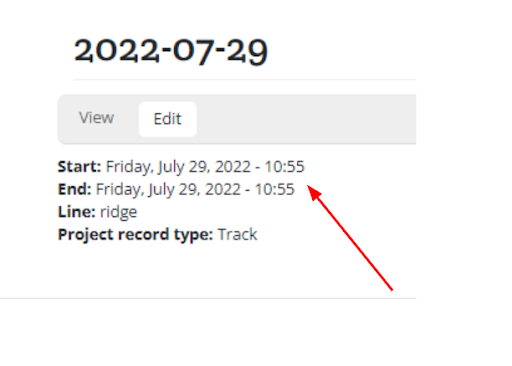
Needing to know the amount of hours taken to service the project? Select tracks when in the App and record your tracks after which you access the projects page on the website, select Reports -Project reports
Select a displayed track the time spent checking the installations will show here
Trap Condition Shows traps across projects that have a condition set e.g. needs maintenance- now includes trap gone

This can also be downloaded as a csv file